

Merry Christmas - Enjoy the festivities
In property we have found Core Logic monthly chart pack as a very useful tool to understand the Macro landscape with respect to property, you can get it free
Why we like let’s learn through examples
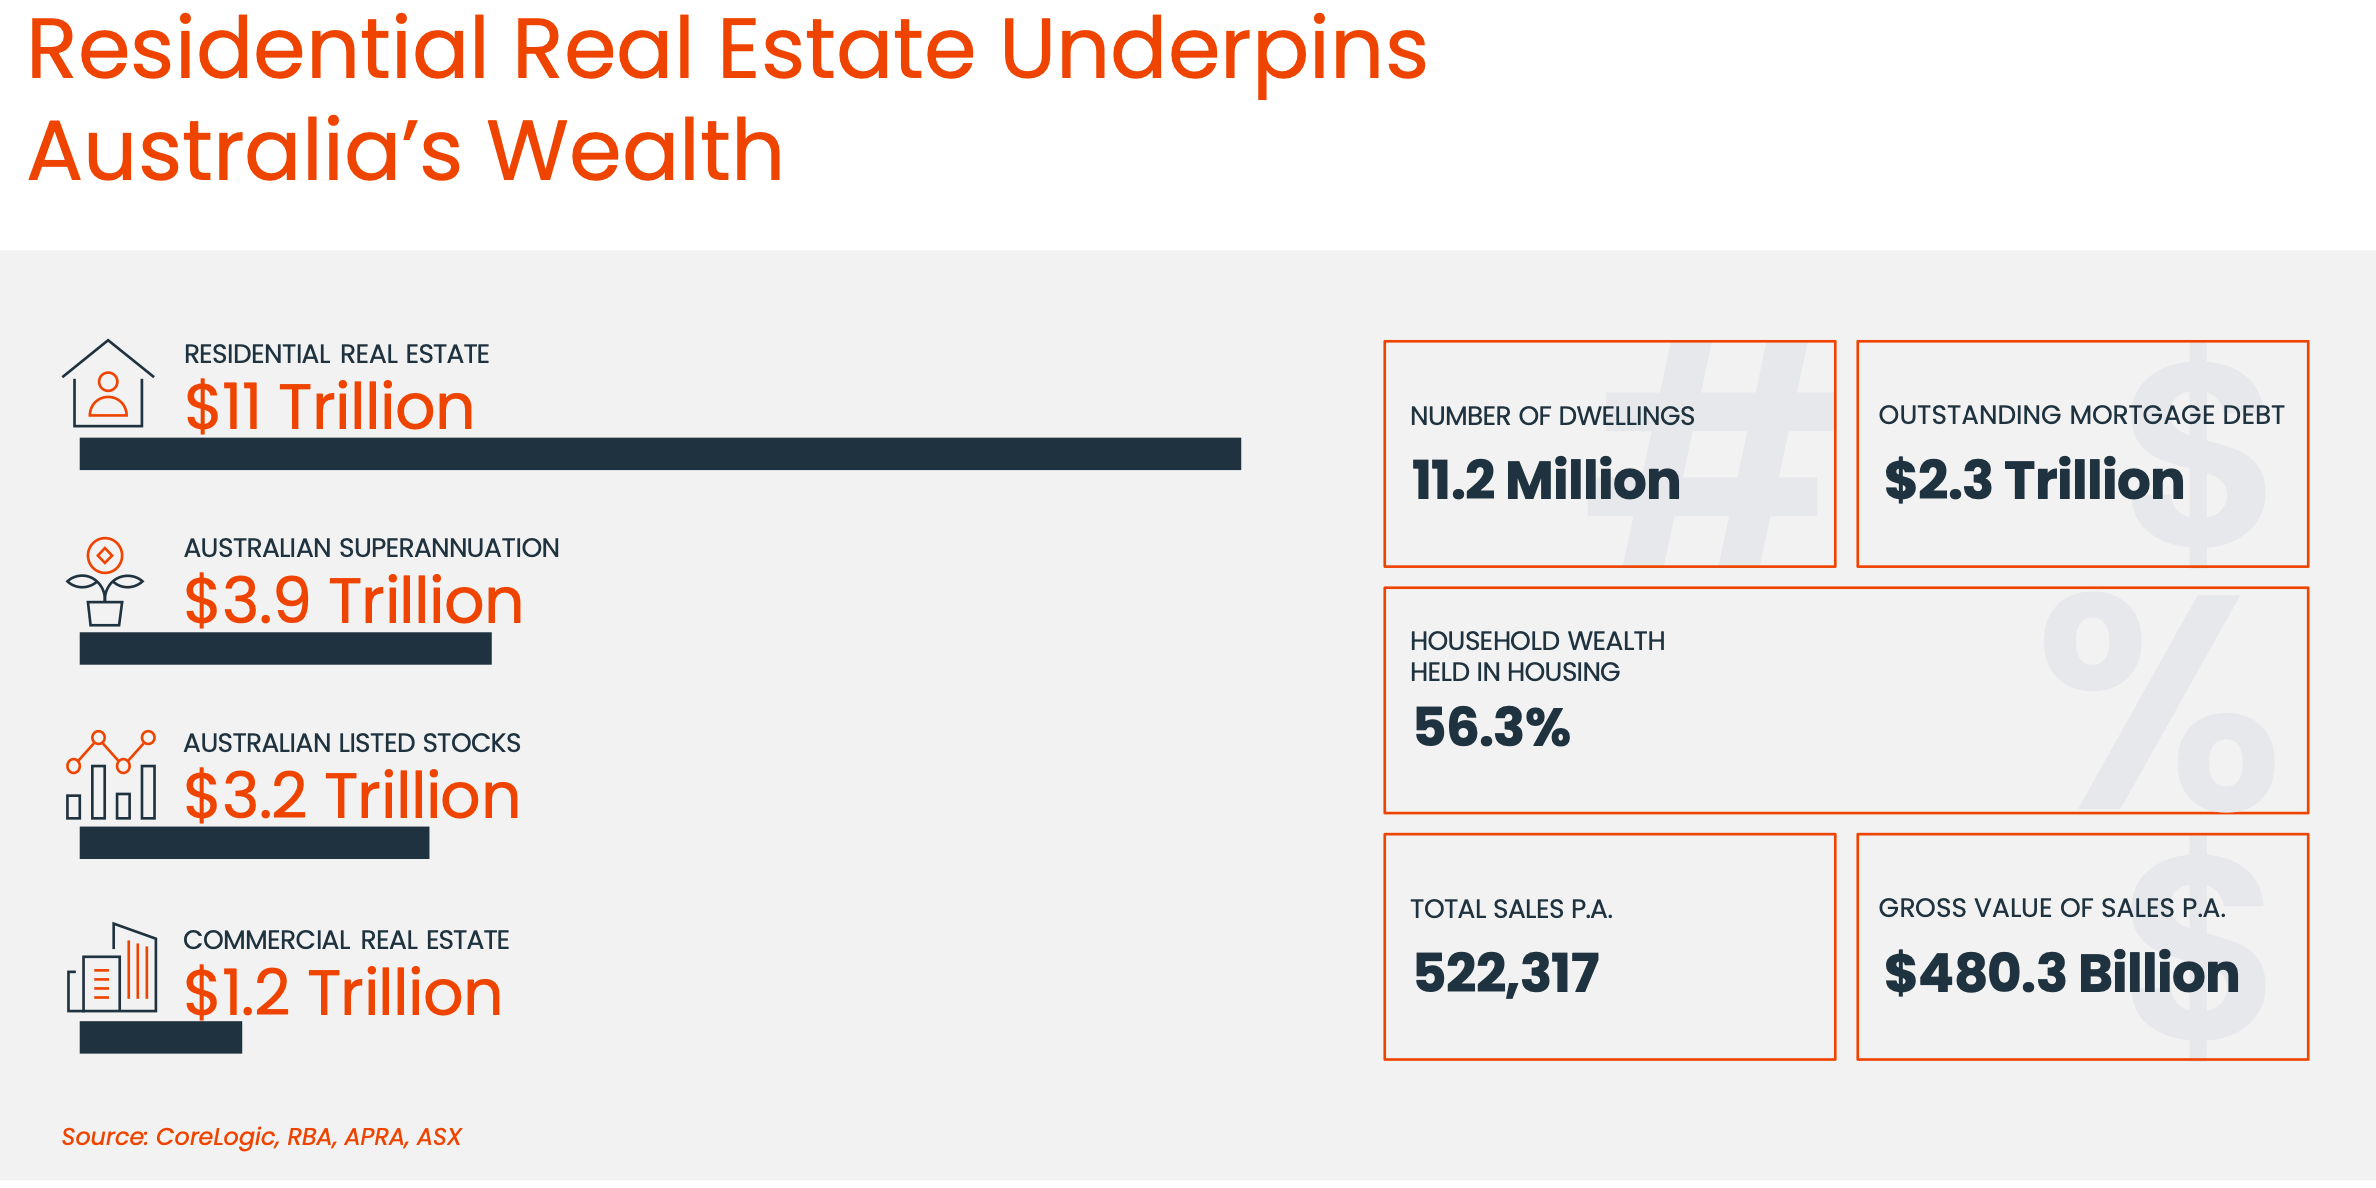
Gives you a bird eye view of Australia’s wealth
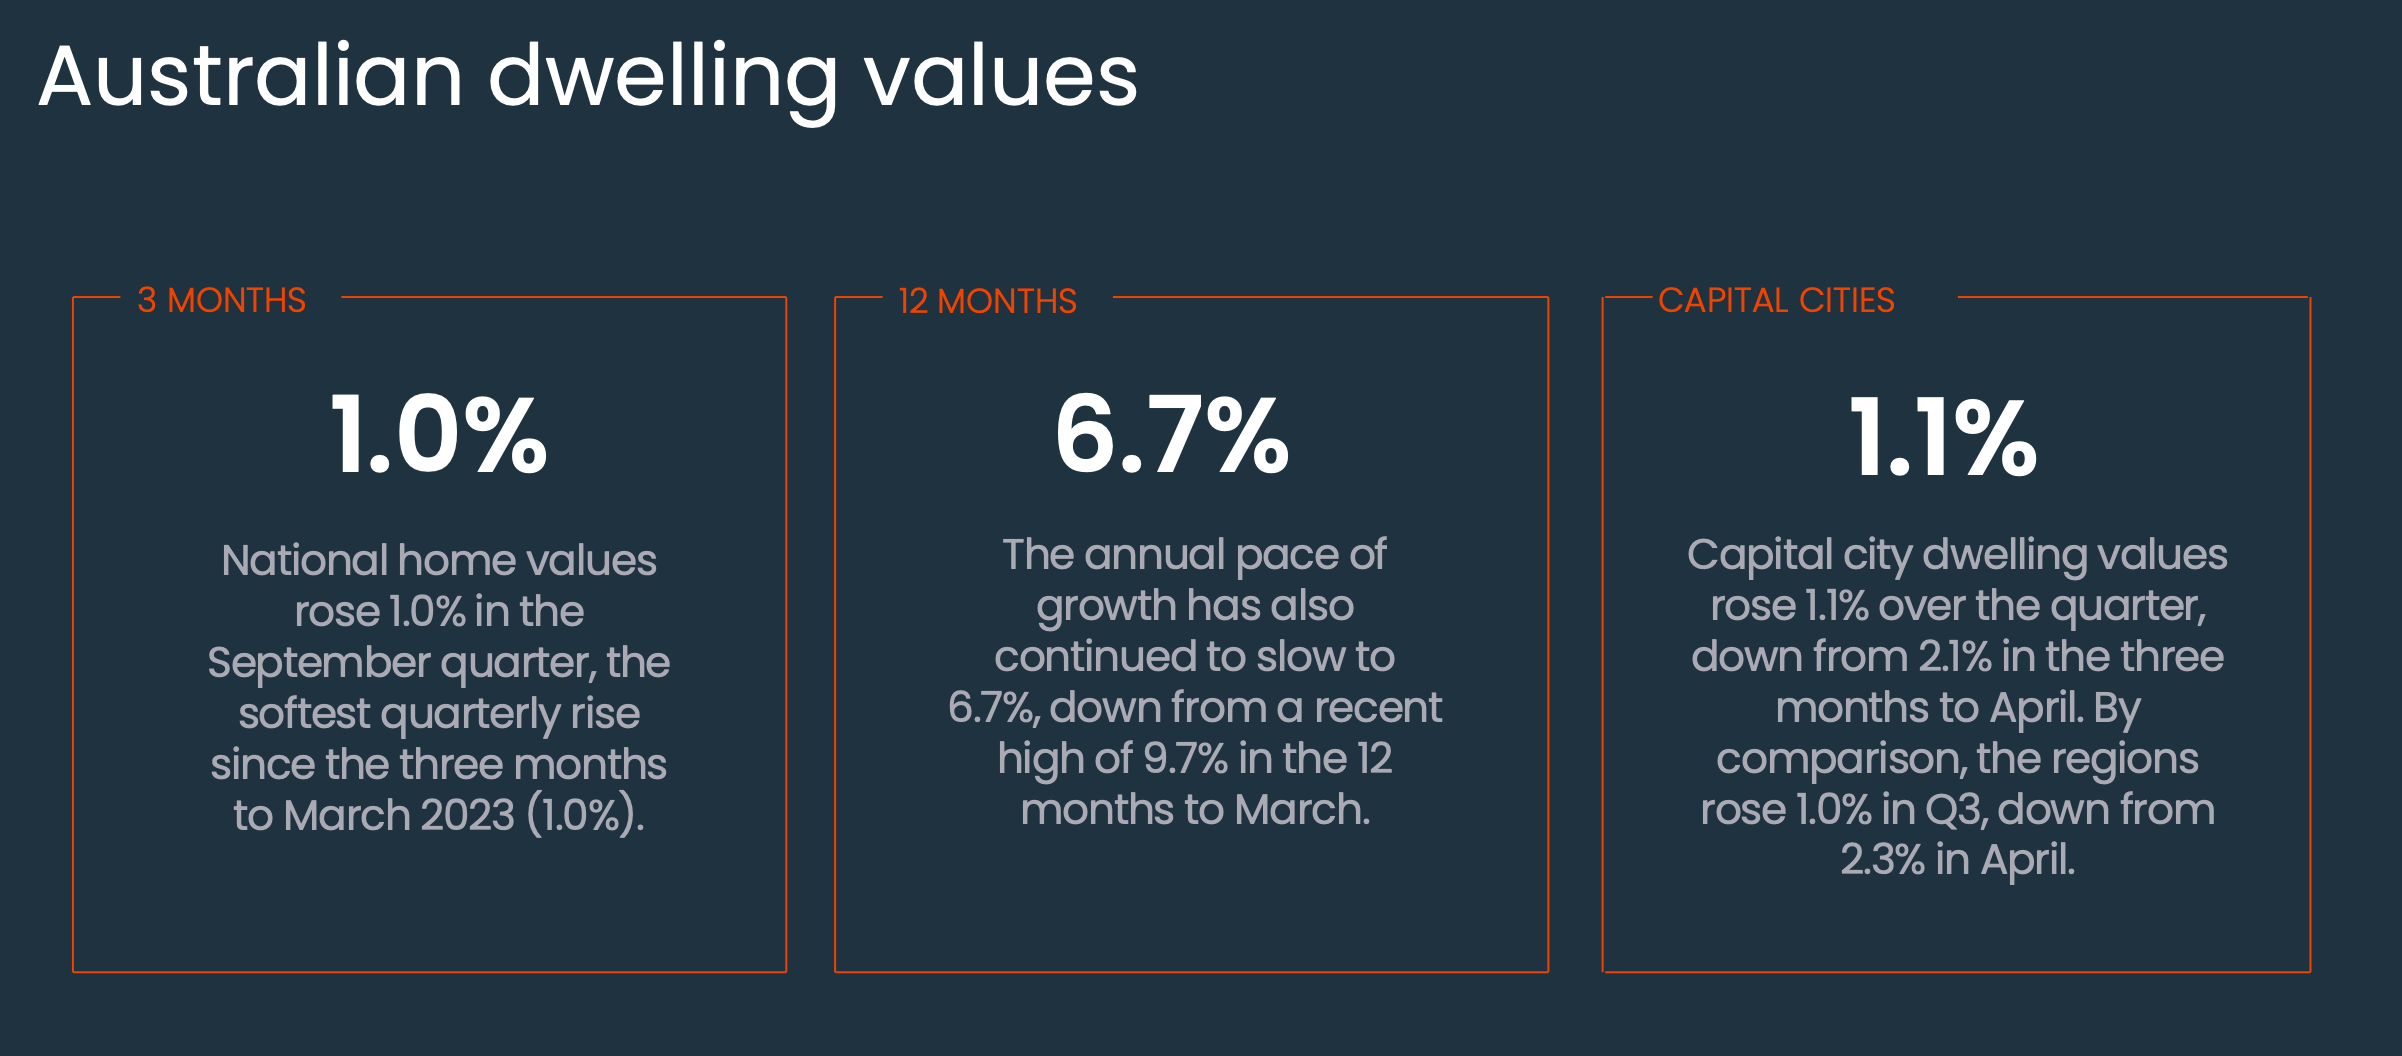
Provides you data on price momentum or deacceleration
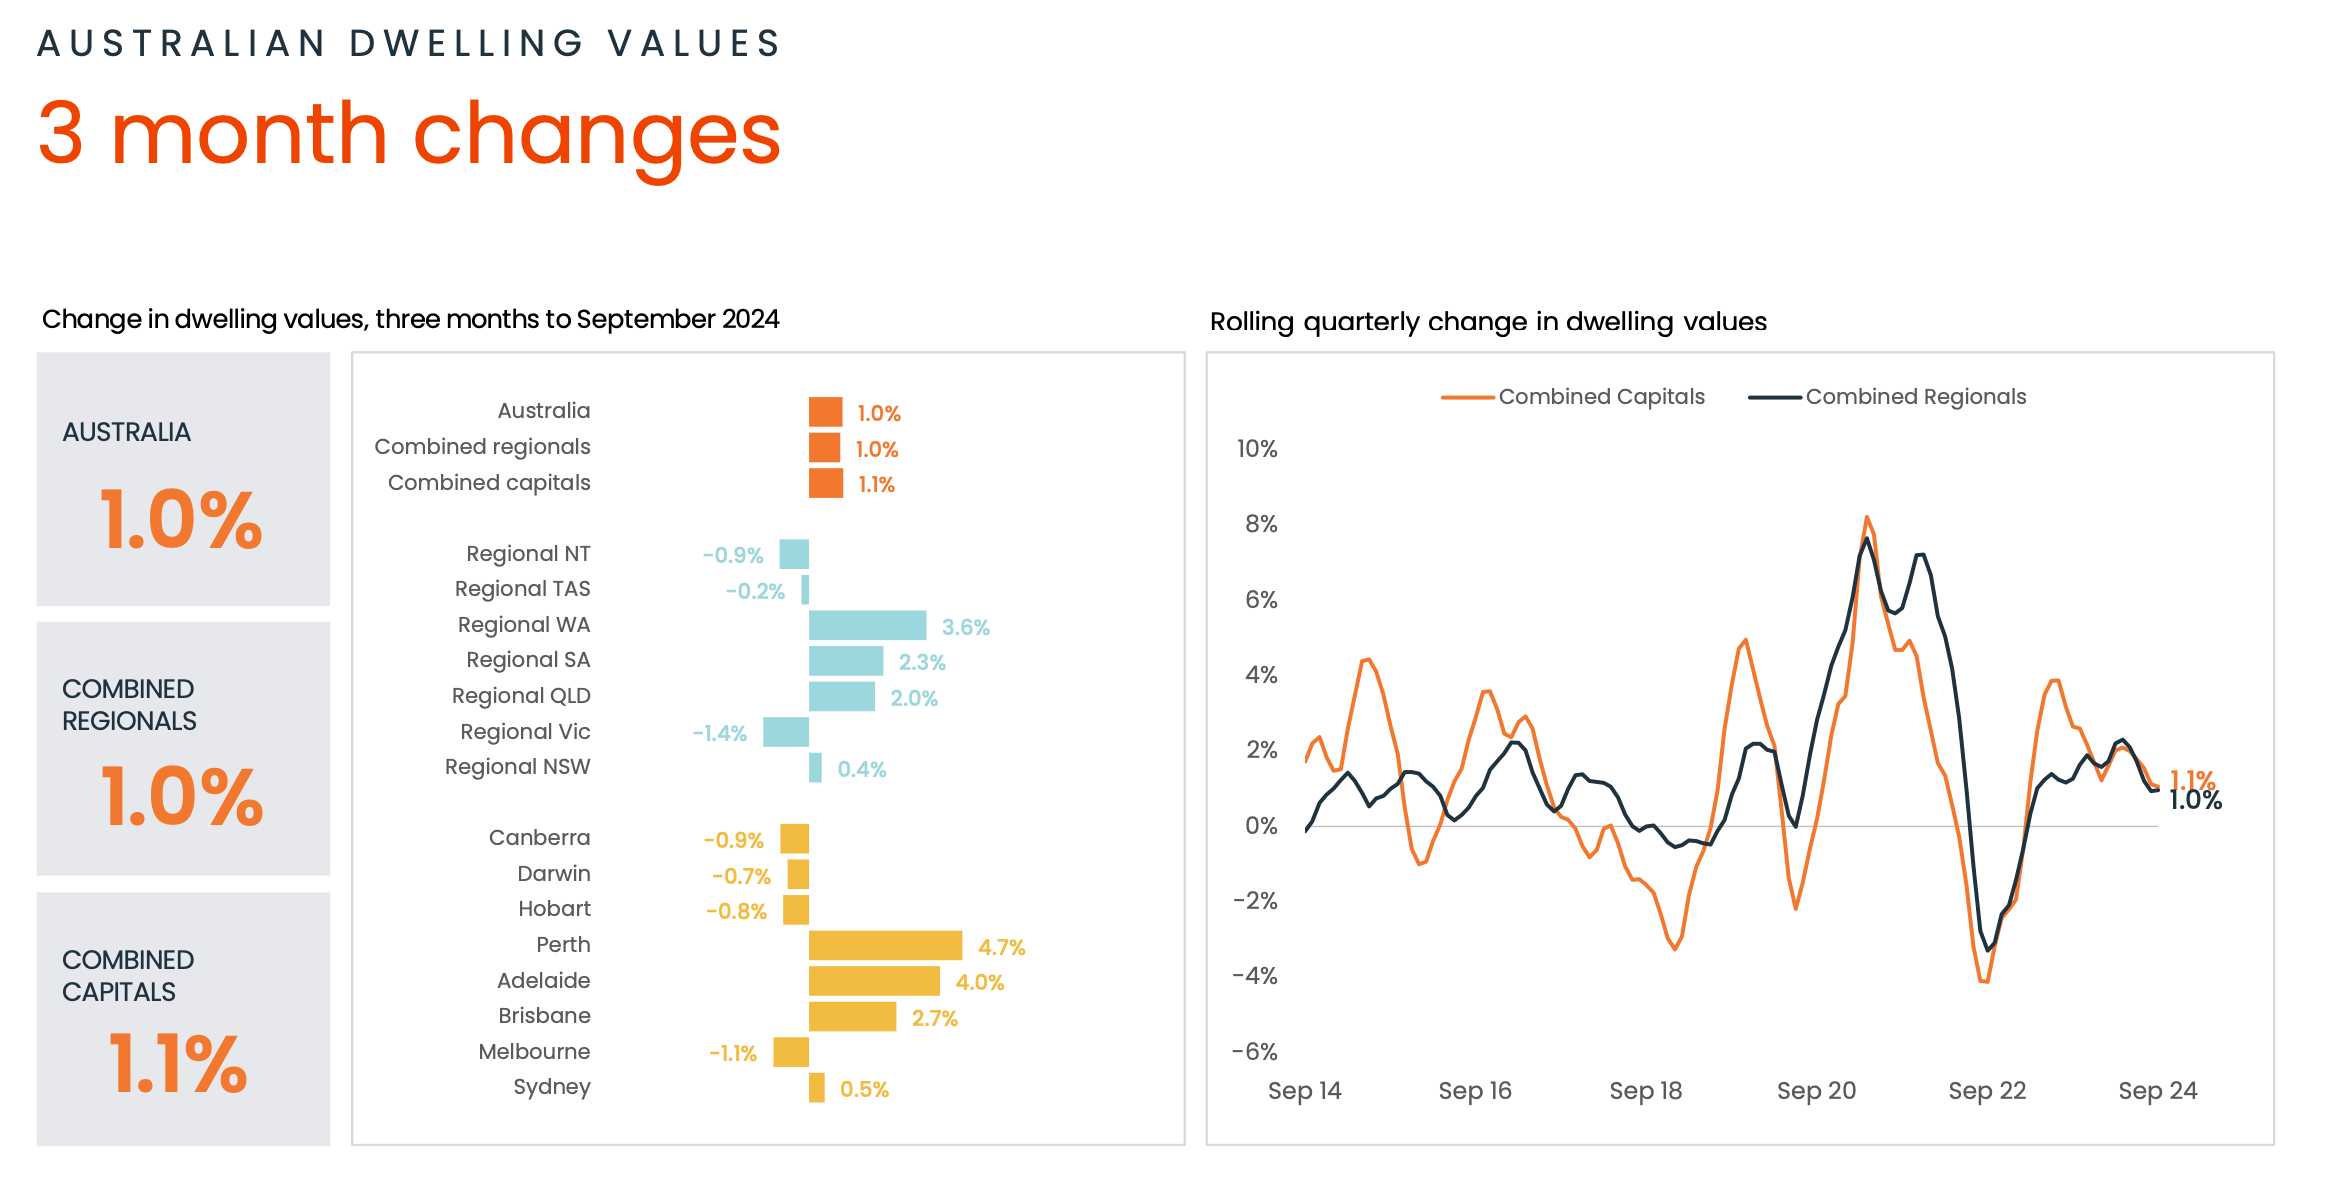
You also create get near term trend in neat graph
along with 12 month changes
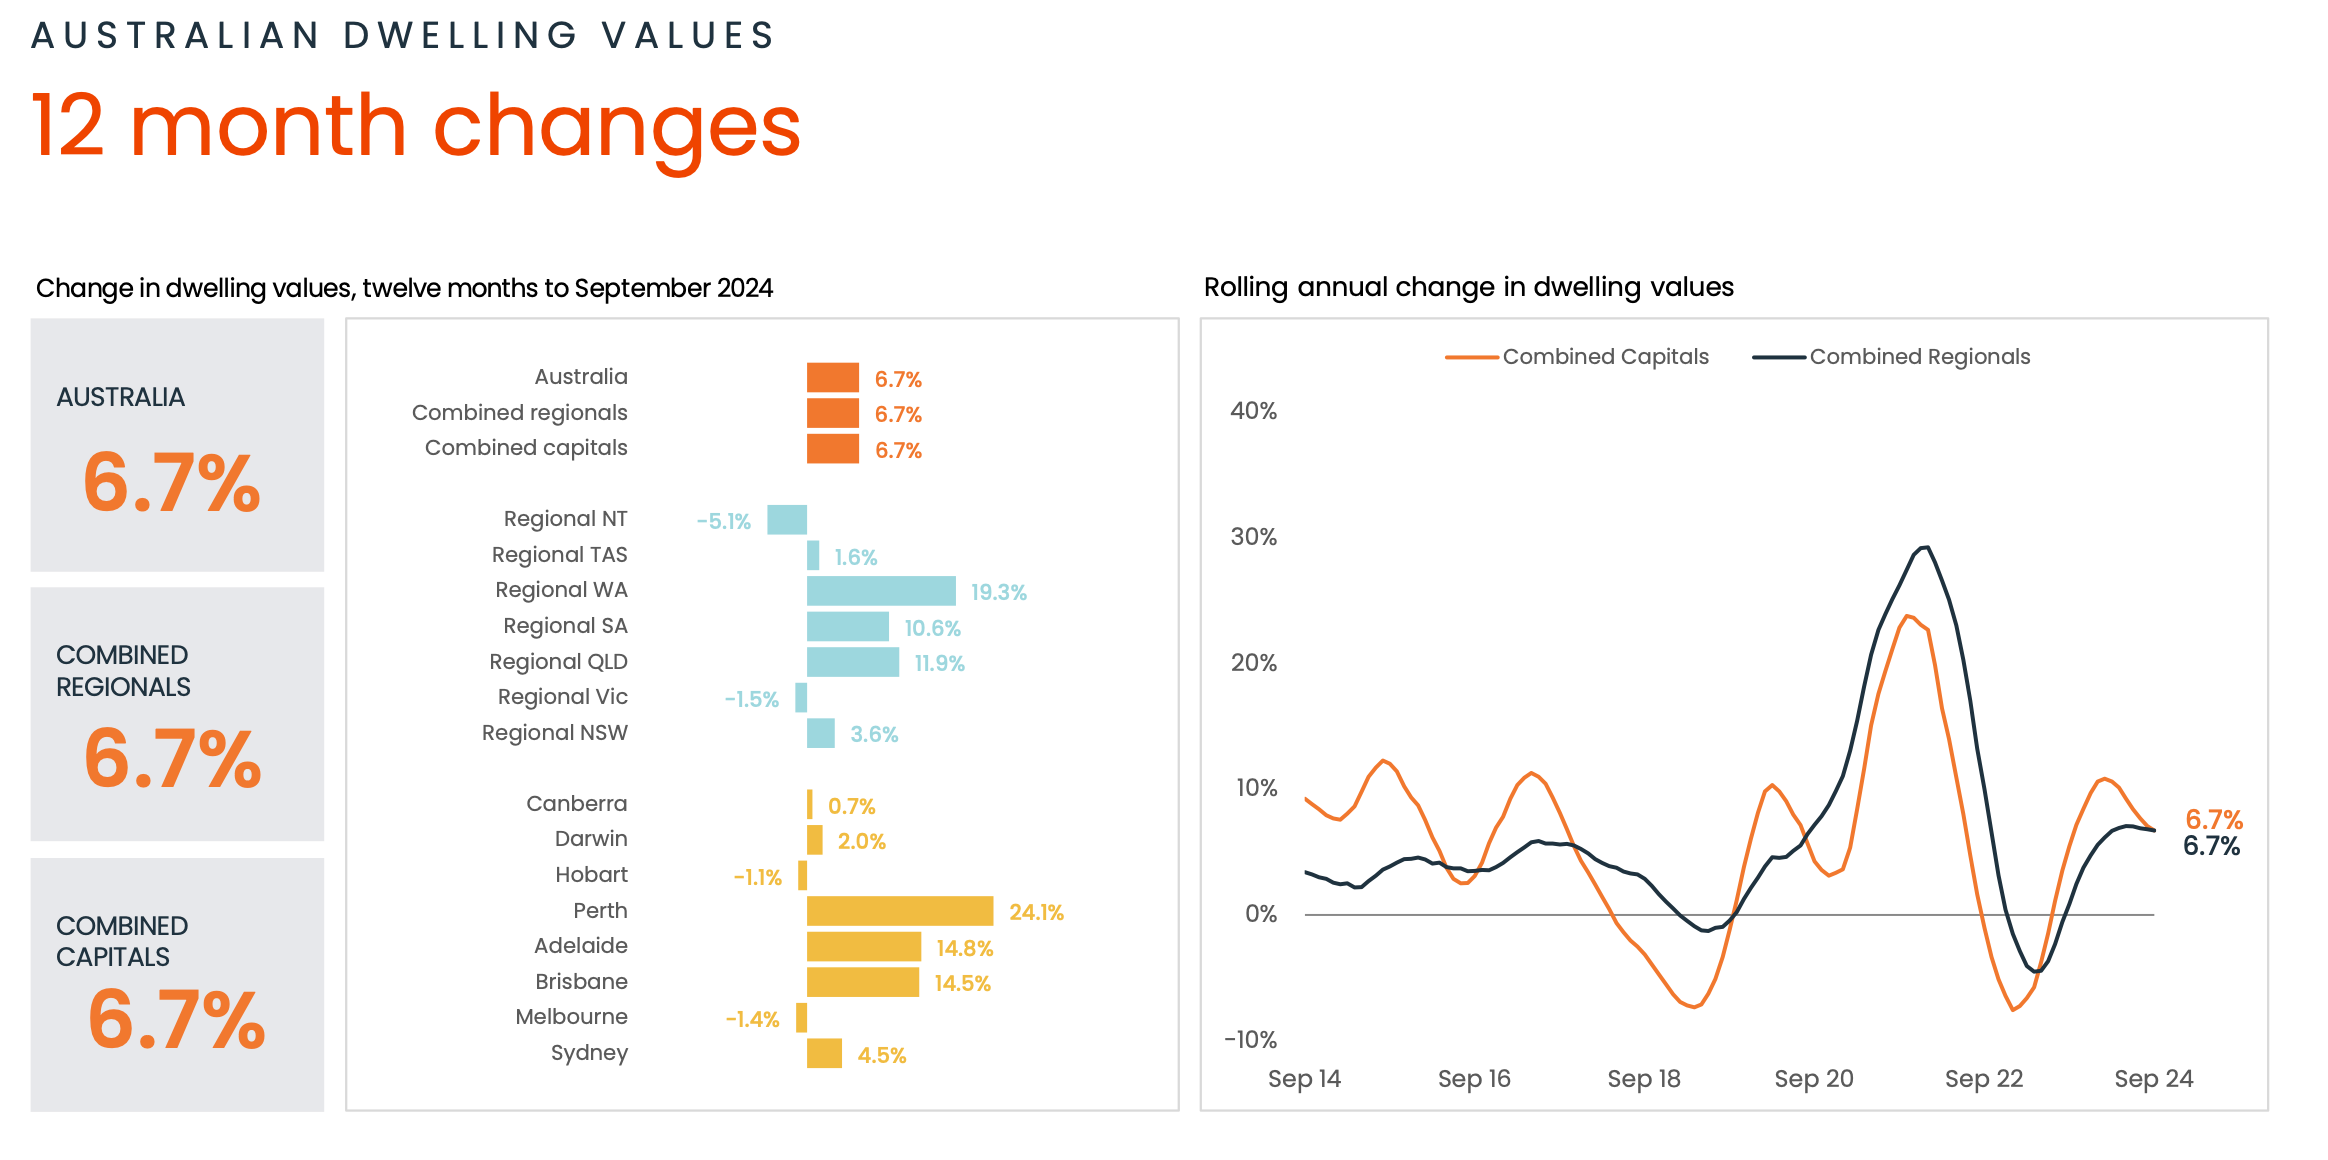
We love below graph which provides which section of property is rising or falling
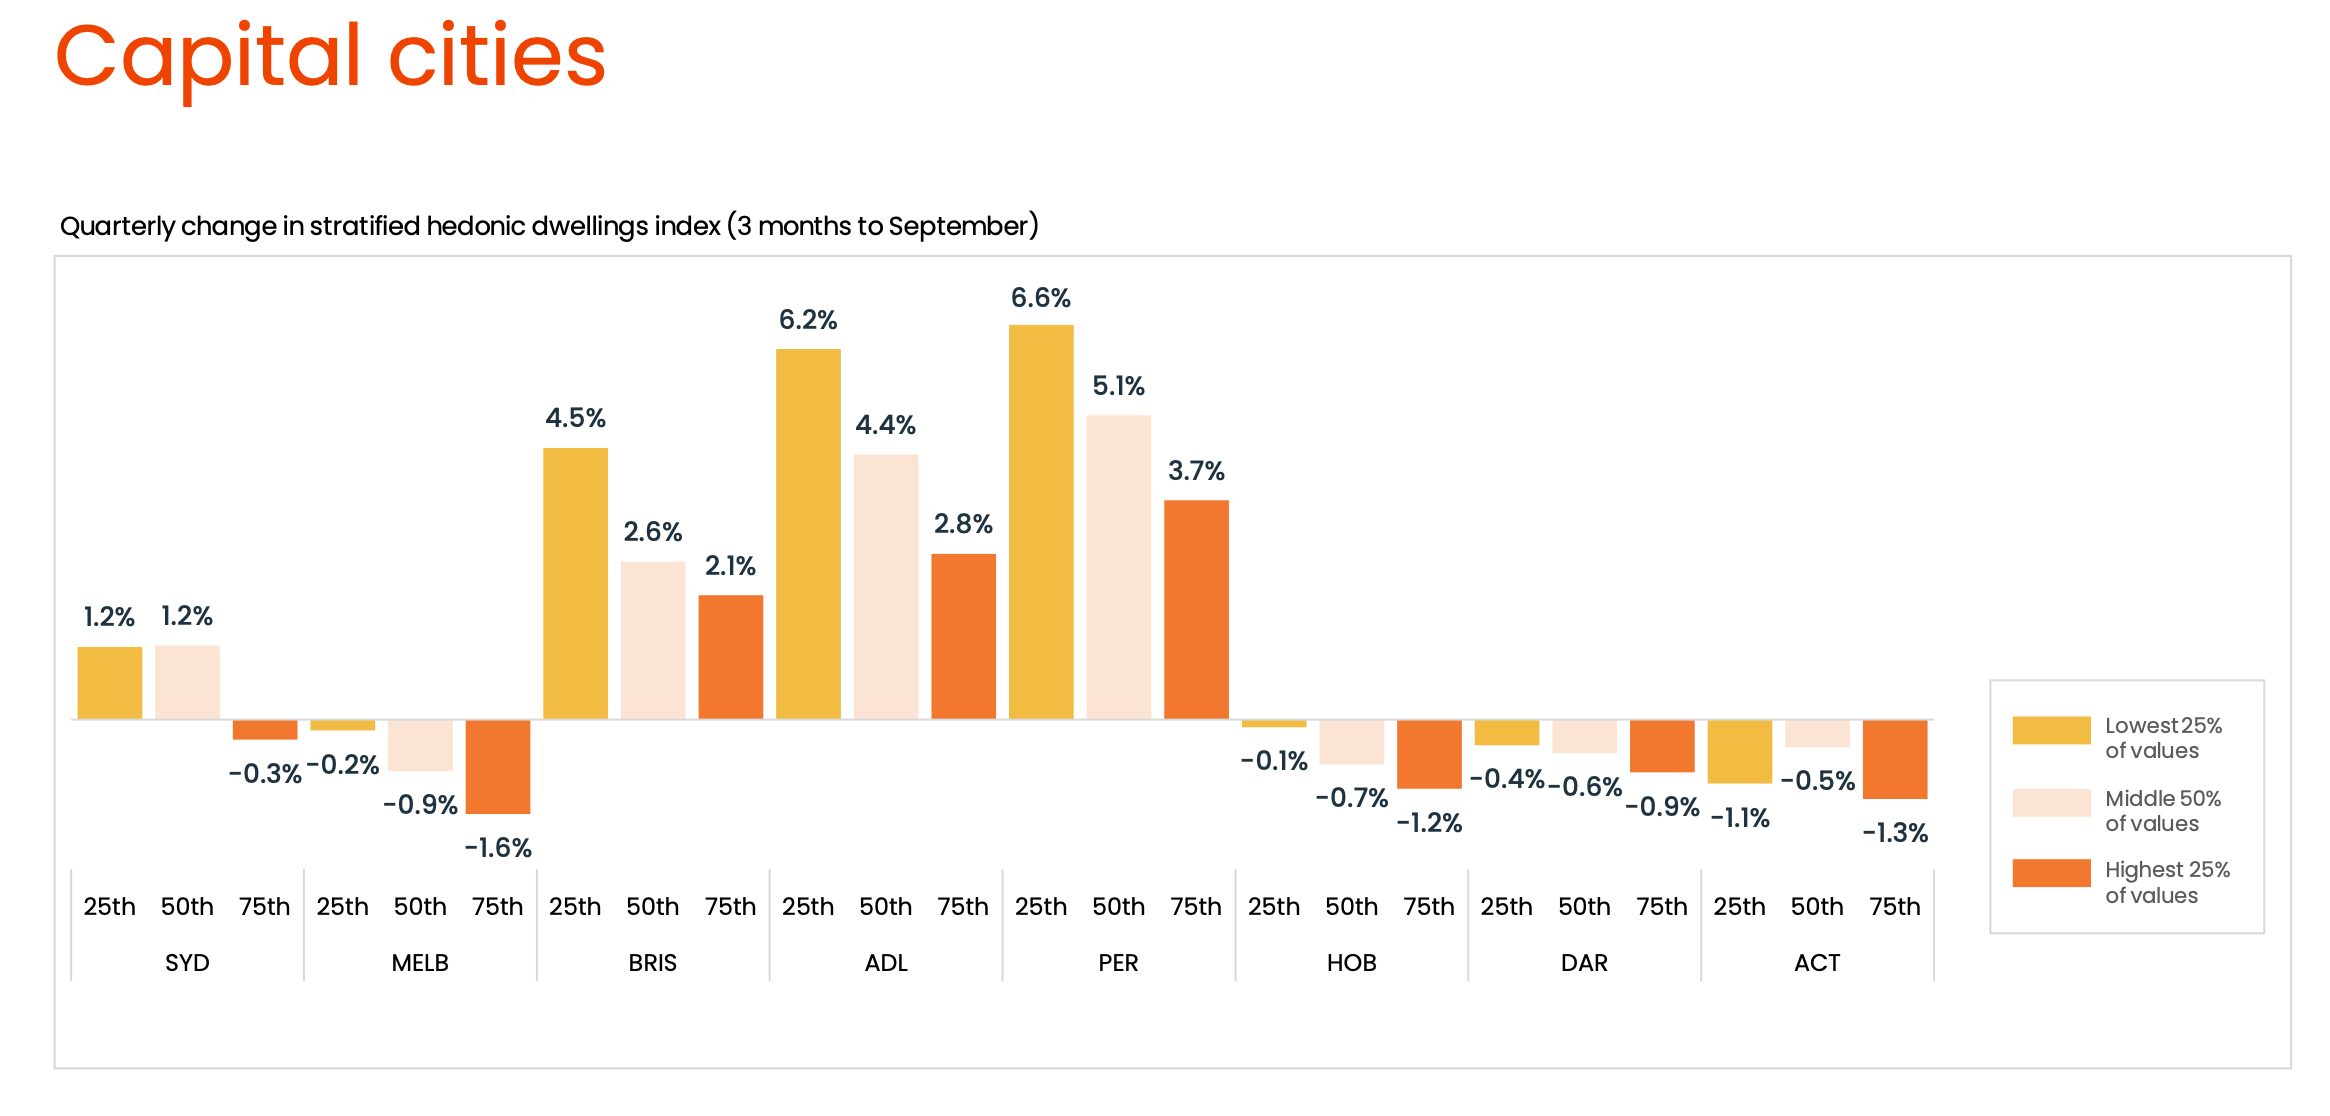
and many more data points like
National Sales overview
Market Cycles
Rental overview
Building and Construction updates
This is a great starting point to build your knowledge, another great starting pointing is subscribing to our paid newsletter
that delivers 5 properties to your inbox every week Christmas or new year, shortening your property search